Logging
The App SDK supports standardconsole methods that work in both frontend and server environments:
console.log()- For general information and debugging outputconsole.warn()- For warnings that don’t break functionality but need attentionconsole.error()- For unexpected errors that break functionality for your app’s users
Frontend logs
Frontend logs appear in your browser’s console. To access them, open the dev tools of your browser and navigate to the Console tab.Server logs via the developer dashboard
The developer dashboard provides a comprehensive logs viewer for your app’s server code across all workspaces where your app is installed. This is the primary way to monitor your app in production. How to access:- Navigate to the Developer Portal
- Select your app
- Click on the Logs tab
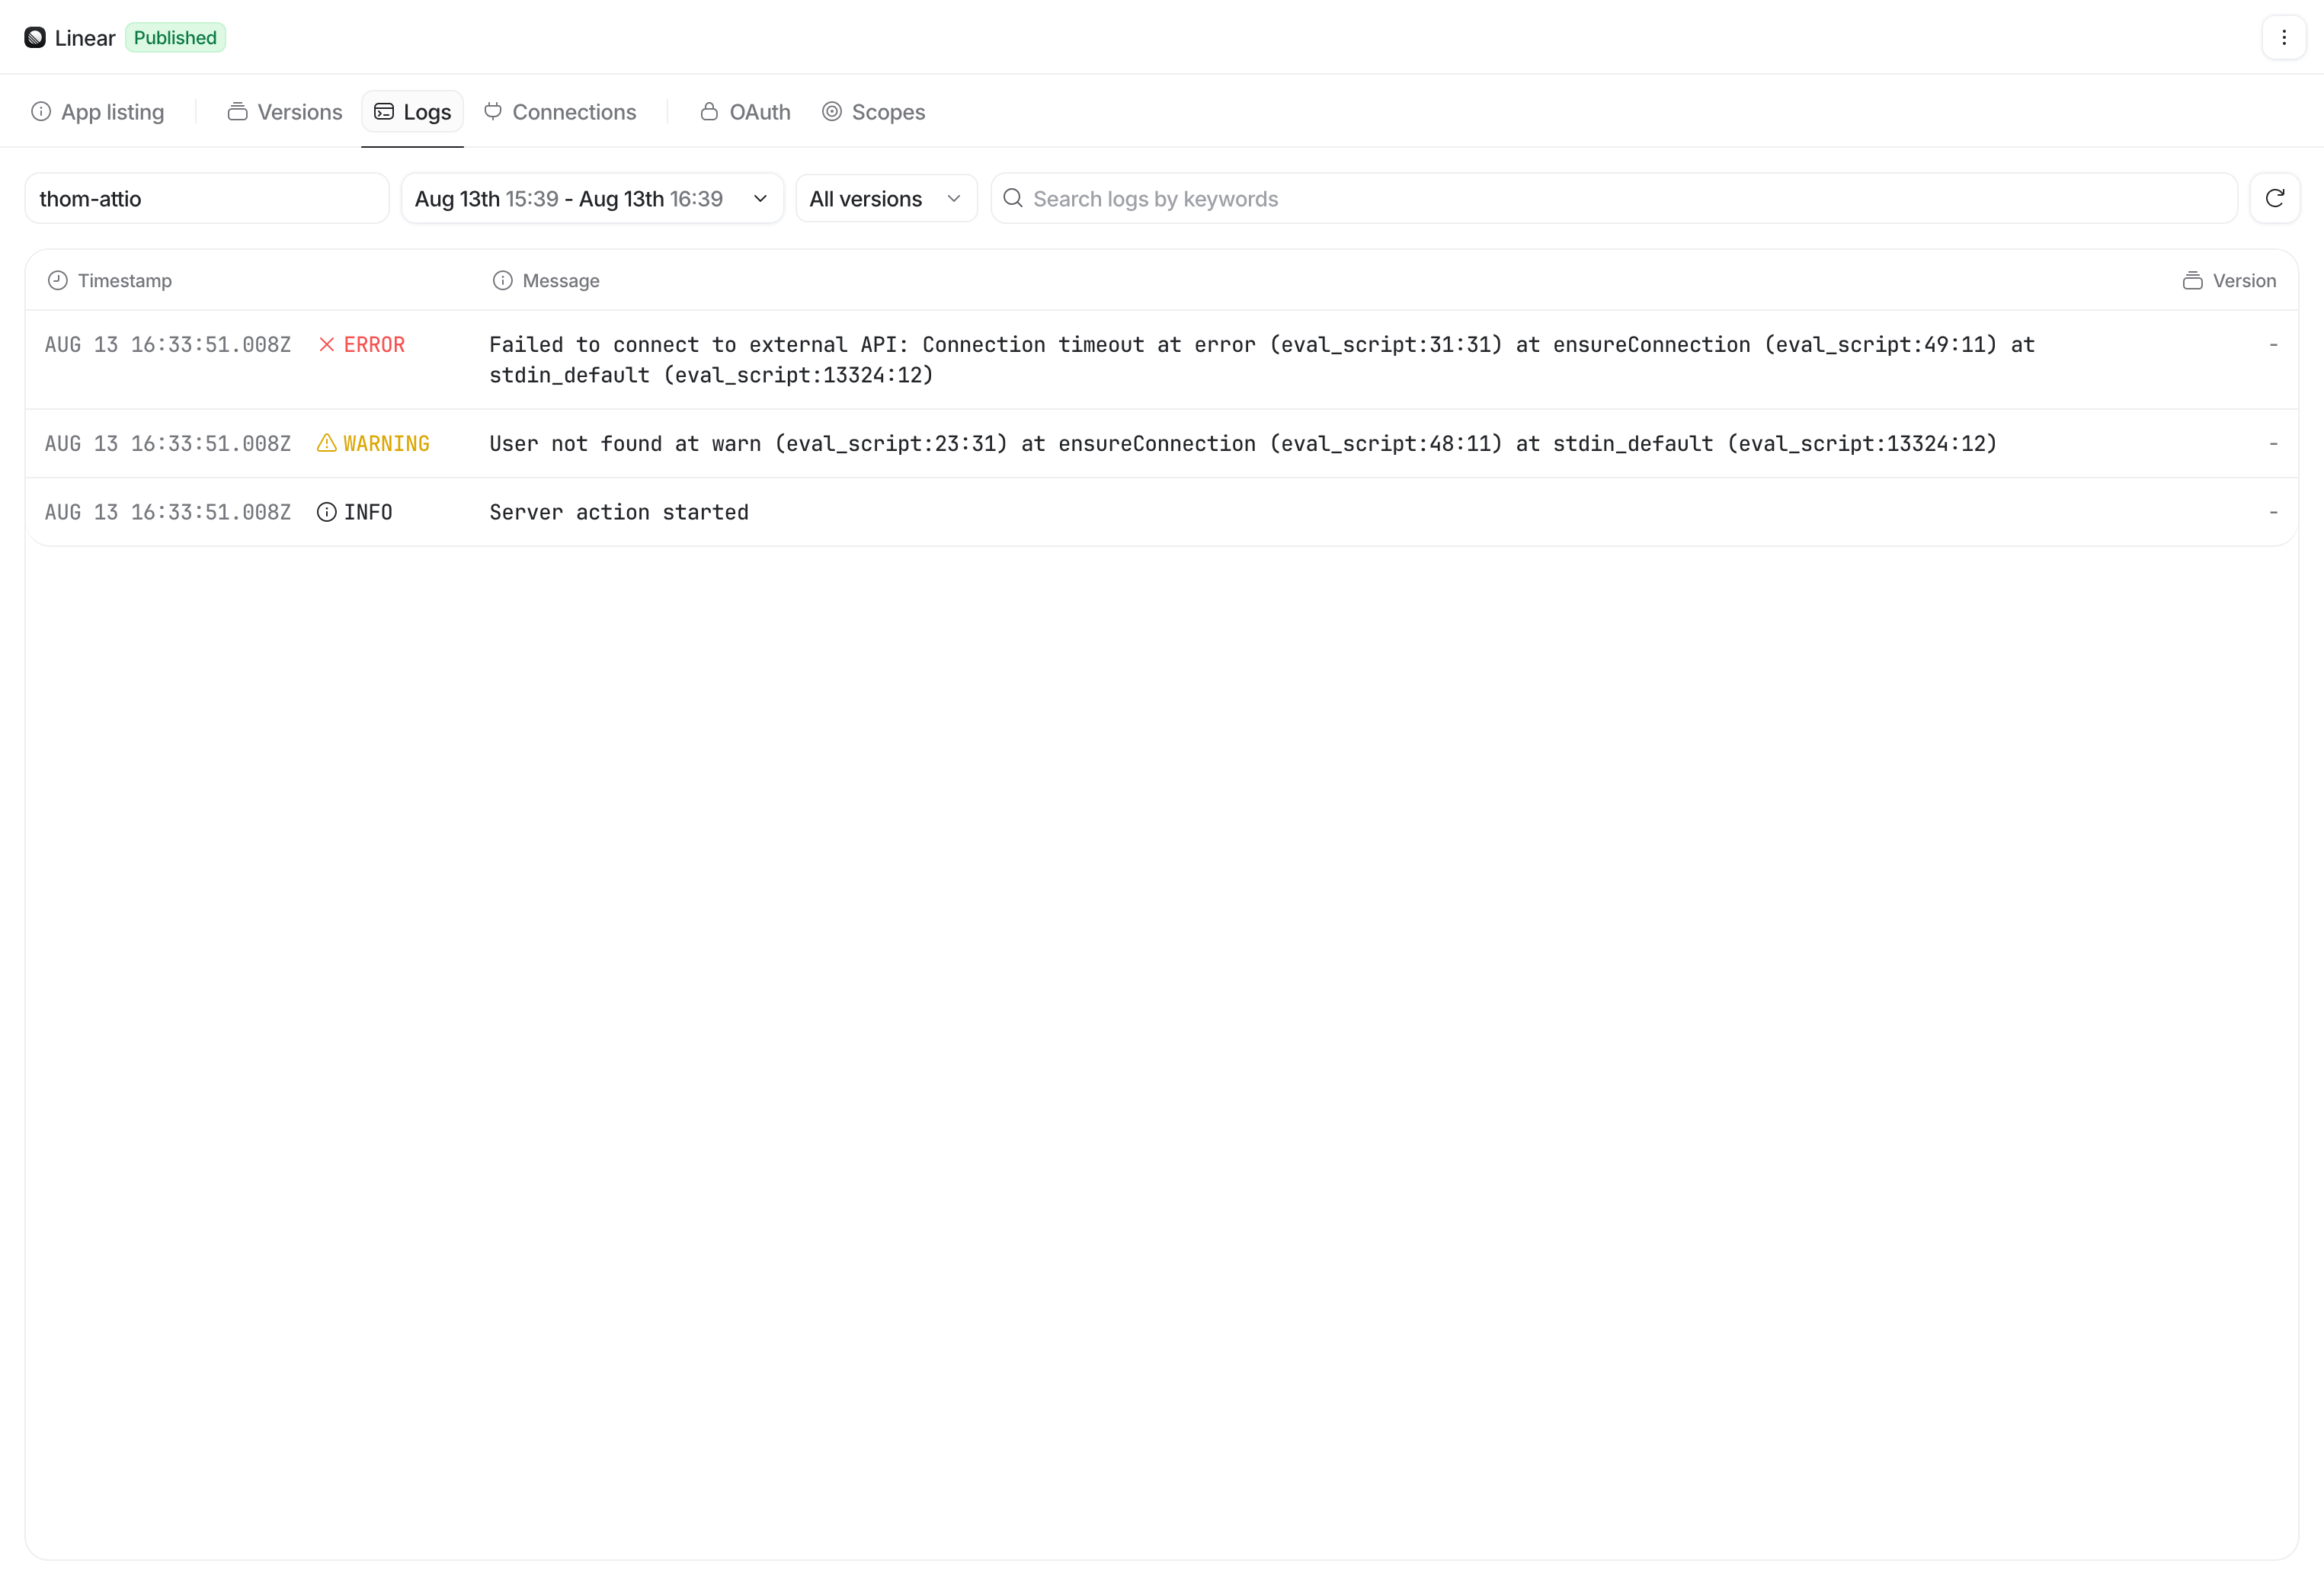
 You can only view the logs for one workspace at a time. To get started, enter the workspace’s slug to select it.